Sunday, August 19, 2012

Sleep Positions: Model X16-1C Accelerometer

I wear the Model X16-1C accelerometer at night, Velcro'ed to the top of my Quattro FX head gear.  The mask head gear is conveniently made to accommodate Velcro because that is how the head gear is adjusted.  I put the accelerometer on the top of my head because there's a strap there to attach to and it's out of the way of my nightly movements.  The accelerometer records X, Y, and Z positions into text files from moment to moment, which I capture and record into a database.

I "calibrated" the meaning of the X, Y, and Z values by putting my head and body into known positions for a while and then looked at the values.  The chart below shows last night's data with some notations about sleeping position.

From this data I can tell what sleeping position I'm in when and how often I'm changing positions.  In the beginning I go to sleep on my tummy with my head to the left, but later, in the middle of the night I tend to roll onto my back, then back on my side again, and back and side... etc.  Near the end of the night you can see that I'm starting into a waking process during sleep as on the far right I become more active, changing positions / moving frequently.

In another posting later I'll show how I relate positions to my brain waves from the Zeo and my breathing and apnea events.

Thursday, June 21, 2012

Model X16-1C Accelerometer

As I mentioned in a previous post, "BasementDwellingGeek" at cpapTalk.com talked about an accelerometer for measuring movements during sleep, breathing, sleeping positions and I suppose numerous other things.  My interest is in sleeping positions.  It is the Gulf Coast X16-1C Accelerometer for $89, plus shipping.

When I received it this is what I found in the box...

The blue device at the top is the accelerometer itself and the black item below it is a rewindable USB cord, very handy because the accelerometer is actually a USB thumb drive (aka RAM drive, nice for getting your data!).  The rewindable USB cord is handy as it could be difficult to plug the accelerometer directly into your PC in close-quarters.  It shipped with a necessary AA battery and a screw driver too, so you could open the accelerometer and put in the battery.  They sent everything needed to fire up the unit.  I was expecting just the blue accelerometer.  I got more than I expected, smart on their part.  You have to put in the battery paying attention to which direction the (+) terminal goes, then you will find that the manual is on the accelerometer's thumb drive when you plug in the accelerometer to the USB (and the drivers install).  The only suggestion I would make to Gulf Coast is to put a little slip of paper in the box describing how to put the battery in (which way) and that the manual is on the RAM drive.

The accelerometer's case is just right.  Rounded corners, no wires dangling, no connectors and a nice cap over the USB connector.  It's 3-4 inches long and probably less than 1" wide and deep.

Since I was interested in sleeping positions, I needed a way to attach this to me.  I had some velcro straps I was not using so I rubberbanded the accelerometer in the velcro and then attached it to my CPAP mask headgear, which is velcro-friendly, that's the way you adjust the straps on the headgear.

Good.  It is actually secure.  It's hard to remove the velcro from the headgear.

Configurable
This device is configurable by adding/changing/removing configuration settings in a text file to customize how often it records values, the number of readings per text (CSV) file it puts on its RAM drive, numerous others. You have to use WordPad in Windows to do this, not Notepad (so they say).  Something about proper line terminations (Carriage Return Line Feed stuff).

XYZ
The nice thing about this unit is that it senses and records gravitational G's.  That means it's recording positions, not just movement.  If you have it at different orientations, it's recording different G's on it's X, Y, and Z axes thus different X, Y, and Z values. So, if I strap it to my body / head and rotate my head, or roll from my tummy to my back when sleeping, there will be levels of X, Y, Z that correlate to those positions. Perfect!

Surprise Bonus... Temperature
Come to find out when this unit writes files it records the temperature for each file following the hour change.  Who knew!  Great!  Now I can have my sleeping temperature too!  Perfecto!

More later on the XYZ and sleeping position with some graphs...

Until then.


Monday, June 18, 2012

New Toy: Accelerometer

On a recommendation by "BasementDwellingGeek" at cpapTalk.com I got a new toy... an accelerometer.  It is Model X16-1C made by Gulf Coast Data Concepts in Waveland, Mississippi.  Here's the web page to the device:

Gulf Coast X16-1C Accelerometer

It cost me $89, plus shipping.  Is it worth it?  For me, clearly yes!

Why an accelerometer?  Well, it clearly tells me my sleeping position.

In the coming days I'll write up what it looks like, what I got with my order, how I set things up to use it, the data it generates and what it is telling me.

Friday, April 27, 2012

Progress

Time for a progress update on my personal performance.  Below you will see 3 trends, my Zeo sleep score, my "Whack a Mole" and my "Goodness", each smoothed with a moving average, since February 20th, 2012.  So, I've been collecting this data for about 67 days.


The Zeo Sleep Score above comes from the Zeo Bedside unit where it scores my sleep by length, quantities of REM and Deep and deducts points for number of times I wake and duration awake.  My Zeo Sleep Score has been trending upward.  Good.

The "Whack-a-Mole" is a measure of my response time by measuring the average time it takes for me to click on a little picture that jumps around a window.  I take this "test" most every morning and sometimes during the day as well.  Lower is better.  My response time is becoming faster, but I sense it is leveling off.

Above is my personal subjective feeling of "Goodness".  How good I feel which I record using a slider, higher is better.  It has also been rising but I see it leveling off.  That may be because I am in fact reaching a plateau or there's a psychological aspect to adapting to "better" and not wanting to slide the bar higher.  These kinds of things is why I collect a variety of performance metrics, and these 3 are not the only ones, there are 8 of them I collect (?!).

OK, so, I've been getting better and that is good news.  I might be reaching a plateau and that is something to ponder ... how to take the next step up.

Tuesday, April 24, 2012

Comparison: "Sleep like Android" vs. Zeo

Someone mentioned accelerometer based sleep monitors and there so happens to be a popular one for my Android (Motorola Android Razr Maxx) called "Sleep like Android" so I downloaded, installed, read through the instructions.  You plug your phone into the power (so it does not fully discharge) and put your phone on the mattress and "Sleep like Android" uses the phone's accelerometer to detect movement to try to classify your sleep in simplistic terms, on a continuum from Deep to Light.  The idea is if you are moving, you are awake or in light sleep, or maybe REM, or something.  Below is an image that compares my ResMed S9 AutoSet respiration (low and stead during Deep, volatile during REM) and my Zeo (big 'eyes' during Deep, volatile during REM) with the Zeo classifications from their website at the bottom.  The black chart is the "Sleep like Android" output.

You can see the "Sleep like Android" output does NOT match with anything from the medical device (ResMed) nor the Zeo brain wave monitor.  It shows "light" during Deep, shows "deep" during REM, the Zeo shows some "Wakes" but nary a blip on the "Sleep like Android"

I may try some additional nights to double check, but in my initial view... "Sleep like Android" does not work and is not useful, at least for me.  This does not suggest other accelerometer based sleep monitors do not work, just that the "phone on a mattress" look to be a weak solution.

Major advantage: My phone was fully charged in the morning, ready for a busy day. :)

Monday, March 19, 2012

Making a Zeo Cable

The Zeo Bedside unit has a serial port which emits the raw signal it picks up from your forehead, the brainwaves; Delta, Theta, Alpha, Beta 1, Beta 2, Beta 3 and Gamma, the sensor impedance and also the 30 second sleep stages.  How do you get this data?

1) Make a cable
2) Get and install a "Real time" firmware upgrade into the Zeo Bedside unit.
3) Get ZeoScope (free)

--------------------

The Cable
The Zeo Bedside's serial port can be connected to your PC using a Serial -to- USB cable, but Zeo does not sell one and if you want the data, you must make it. The cable itself is a RS-232 Serial to USB, so there's a chip in the USB connector thus one cannot use a standard USB cable and "hack it up". To make mine I followed the directions here:
http://www.sleepstreamonline.com/rdl/starting.html

To make it, I got these parts:

http://www.mouser.com/Search/ProductDet ... 16-02-1114
(5 each, to have a couple spares, they are cheap... wire termination connector clip thingys)

http://www.mouser.com/Search/ProductDet ... 50-57-9405
(1 each the plastic 5 pin connector)

http://www.mouser.com/Search/ProductDet ... 32R-3V3-WE
(1 each, $20... the cable itself)

--------------------

The Firmware Upgrade
It's explained step by step at the same web page on how to make the cable:
http://www.sleepstreamonline.com/rdl/starting.html

--------------------

ZeoScope
ZeoScope is PC software available for free here:
http://www.github.com/dancodru/ZeoScope

Have fun watching your brainwaves streaming by... Look left, look right, watch the wave patterns.  Take off the Zeo headband and press it against your chest... WOO... One of the weirdest EKG's you've ever seen. :)

Saturday, February 25, 2012

Zeo Sleep Score: Mean Anything?

The Zeo puts out a sleep score based on hours slept, the amount of time in REM and Deep sleep and the number and duration of waking during the night.  Does this have any bearing on how you feel or perform, really?  In some initial data collection, the answer is YES. 

From time to time I do a home-made "Whack-A-Mole" type of measurement of response time.  In this little performance game an image appears in random locations 10 times in a window and I must mouse to the image and click on it.  The average time it takes between clicks is logged each time I play the game.

If I do a chart of my Zeo Sleep Score vs. my response time it looks like this:


You can see when my Zeo Sleep Score is low, my response time is high (I'm slower to respond) and the reverse is true.  Mathematically the correlation is low, but to our eyes we can see there is a relationship between these two independently arrived at metrics.

Wednesday, February 22, 2012

Clustering Zeo Brainwaves

One reason "sleep stages" exist is so one can quantify how much time was spent in what kind of sleep. It is a multiple level discrete classification of what in reality is a continuous process, but none the less the concept of "sleep stages" is useful.  I would like to identify the nature of my sleep and associate how I feel the next day based on how much of what kind of sleep I had.  If I can identify and count the duration of different kinds of sleep I might be able to correlate that with how I feel, hence I could then get a handle on sleep quality.  People say the more "Deep" and "REM" you get the better, but I'm guessing there's more to that story.

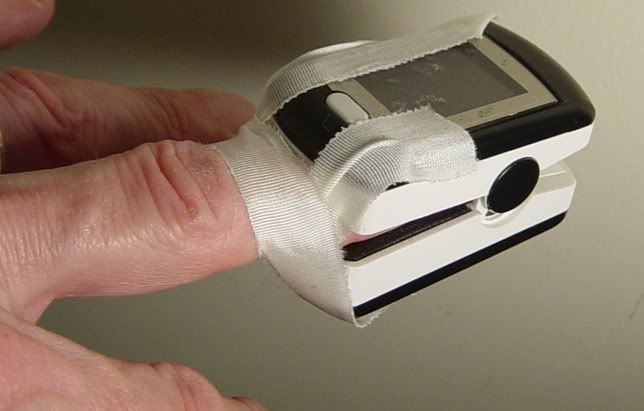
The challenge I have is that I only have a Zeo, which is a 3 lead frontal lobe EEG non-medical device and I get a bit confused on how sleep is categorized based on the dominance of this wave or that.  This is compounded by each person being different and I read today that Obstructive Sleep Apnea (OSA) persons have somewhat abnormal sleep as well.  I could use Zeo's classification of sleep stages (I might, I have them in real-time) or I could come up with my own scheme.  In this adventure, I going to make my own.

I have Zeo brainwaves (Delta, Alpha, Betas, Theta, Gamma) and sleep stages (Wake, REM, Light, Deep) gathered via a serial port from the Zeo Bedside unit archived in real-time to a historian.  I can extract the data between one date/time and another such as a night's sleep.  Last night's data looks like this:


Now, I'm no expert in sleep stages, but I am one in data analysis and I see a few different forms of sleep.  For this adventure I'm not going to try to identify the sleep stages using the established medical definitions (if it is even possible with the Zeo), but I'm going to let the data itself decide what it sees.  How am I going to do this?

Clustering
Clustering is a data method that separates data into "piles" (clusters) based on their similarities and differences.  In this case the software looks at each moment in time and decides if the Delta, Alpha, Betas, Theta, Gamma wave values (amplitudes) are similar to all the other cases.  In this exercise I took noise out of the data by taking 30-45 second averages of the data (just a double-click in our software).  Then using a "Self Organizing Map" (SOM), I group the data based on its similarity.  SOM's use a process that moves similar data towards each other, and dissimilar data away from each other, on a two dimensional map.  That way I can take the 7 wave forms (7 dimensional data) and project it on a 2D surface, like moving chips around on a table, putting similar ones together automatically.  We humans can think in 2D and 3D pretty good.  7D is very difficult for us mere mortals. What you get after the SOM groups the data is something that looks like this:


Very pretty.  Rather impressive.  Good to have on your desktop when the boss walks by if you are a data analysis person (wink).  Each square has very similar data within it and neighboring squares also have data with similar characteristics.  The closer the squares, the closer the values.  Adjacent red regions contain very similar values.  The green, yellow and blue indicate larger differences, like mountains or valleys between the red regions.  I can group these squares (and the data within them) into clusters of similar data by setting a "data distance" (dissimilarity) criteria.  Below you can see 5 different gray regions (clusters) each of which contain similar data.


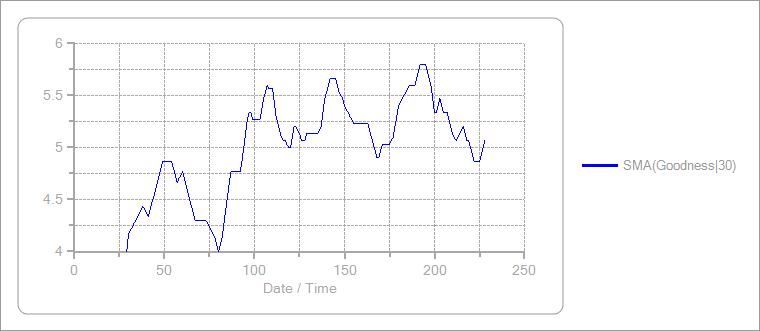
OK, so what, you ask?  Well, I can then export out the members (rows of data) of those clusters and their cluster number.  That cluster number is very similar in concept as a sleep stage and look at what it shows us...


At the very bottom you can see the blue line that is our "home-made" Sleep Stages but in a different numbering scheme, independent of any medical professional, based on my personal data.  In comparing the cluster number to the Zeo's sleep stages I can see it is somewhat similar to what the Zeo indicates, but I also see that my scheme identifies the character of the data better, because the Zeo is trying to conform to medical definitions where mine conforms reality.

The blue line is actually smoothed with a simple algorithm that says if the current row of data is uncategorized (not in a cluster) then presume it to be in the just-prior cluster.  That's not perfect, but a pretty good assumption on a real-time continuous process like the brain.  Doing this type of post-processing helps reduce the noise in our new "Sleep Stage".

Next Steps
I can run this clustering "model" in real time with the wave data coming in and auto-assigned to my custom sleep stages and either in real time or after I wake up I can count how much time I slept in what type of sleep.  I can use this, or the Zeo's sleep stages, or both to hopefully correlate that with how I feel the next day, and also correlate it with what I did before to get such sleep.  We'll see about that in future posts.

The Button Box

I've begun the collection of a variety of factors that chronicle my response time, how I feel, nutritional factors, exercise, stress at home and work, medications I take, APAP settings, sleep environment, blood pressure, Zeo sleep scores, etc.  To do this, I have created a "button box" that I can click an appropriate button and record these things.  It's not a real flexible application suitable for others, but it does the job OK for me.  I think I have most of the factors I would like to capture and I may add more as I go forward.  The most important is how I feel and so I have buttons for overall goodness (1-10), groggy, achy, headache, puffiness, arrhythmias.


When I click a button, depending on the nature of what I'm recording, different things happen.  For response time, I am asked when I woke up and how long it takes to set a time control is logged.  Then a "whack-a-mole" type of little game appears where I have to click on a image which then randomly moves to another position on the screen.  It moves 10 times.  The average time between the image appearing and when it gets clicked is recorded.  This actually seems to capture my hand-eye coordination skills fairly well. For exercise, it asks for the start time, duration and the average heart rate (a proxy for exertion).  For single dose things, like taking an Excedrin (aspirin / acetaminophen), it just records a "1" in the Excedrin variable.  Some factors ask for a judgment on a scale of 1-10.  All entries are time stamped so I can later compute their timing, inter-relationships through time, etc. If I look at them as being before a sleep they potentially could then be a causal factor, or perhaps look at them as coming after sleep, making them a potential a consequence of good or poor sleep.

What am I going to do with this data?  A lot!  That will be the fuel for a lot of future topics.

Greatest challenge: The discipline to use it.  When I do something, I need to click

Wednesday, February 15, 2012

Attaching the CMS50E PulseOx for Overnight

I use the Contec CMS50E pulse oximeter and put it into record mode and sleep with it on my finger.  OK, so how do I not have it fall off at night?  I tape it on...

I tear two 0.25" wide strips of medical tape about 4" long. I put on the CMS50E then drape the center of the tape over my finger and attach the tape ends on the underside of the pulse ox, then repeat such that the 2nd piece of tape comes up from under wrapping my finger and the ends are on the top of the pulse ox (or vise-versa, as shown). I can use the tape tension to control how tight the pulse ox is clamping on my finger. The two pieces of tape last a couple weeks before needing to tear off a couple more strips. I have great control over tension of the clamping-on of the device, from crushing to flippy-floppy and everywhere between. Try it. It won't come off.


Wednesday, February 1, 2012

Still Preparing: Events

I'm still preparing for having all the data I need / want.  I have the Zeo's brainwaves in real-time, Contec CMS 50E post-sleep (which is fine getting it after the fact for now) and the ResMed S9 AutoSet data post-sleep (I don't know how to get it real-time, tho it has a serial port).  So, for the real-time time series I'm in pretty good shape.  However, I need to track various "events".

Events
An event is something that occurs at a time and generally has a start-time, end-time and duration.  Having any two allows you to calculate the third automatically.  So we put an "Event" object into our software and put them to use because I have events from the ResMed S9 AutoSet; hypopneas, obstructive apneas, central apneas and recording start events.  In ResMed terms, the apneas have an end-time and duration because they are determined after the fact, and the recording start event is instantaneous: the start-time only.  These are already gathered and stored in our real-time historian with the ResMed data collection we do.  This is spiffy because our software has multiple tasks, an spO2 and ResMed file watcher watching a directory and when I've gathered the files I just drag and drop them into that folder where they are "sucked up" and the data is put into the real-time database and the original files are automatically archived for back-up purposes.  OK, I'm getting off topic...

I need to add my own events too, such as periods of time I feel groggy, or really good, or something else of merit that should be recorded.

Doses
A close cousin to an event is what I call a "Dose".  This is an event like activity (has a time and maybe a duration) that has a quantity associated with it.  I call it a Dose because it's like taking a medicine.  "I took X mg of Y drug at Z time", or I just drank a full pot of coffee at this time.  Even exercise is like a dose, "I averaged an aerobic heart rate of X from this time to that time".  Having these events, time stamped, with quantities, gives me information about how much, how long before sleep-onset they occurred, or totaled during the day.  This way I can log that I had a pound of steak for dinner, or took two Excedrin at 10 PM or had an hour of "this strenuous" exercise at 2 PM or 1 cup of Tulsi Tea 10 minutes before bed, etc.

Once I have these Events and Doses, and a means to enter them easily, I'll have I think all that I need.

Strange REM

As I continue to prepare for doing some experiments (more on that in the next post) I had some strange brainwaves during my first REM period last night.  Check out the chart below:

(click for a bigger picture)

This is an image of the various frequencies streaming real-time out of the Zeo into our software during the period of interest in my sleep last night. The first section that looks domed, or a "fish eye" as I call it, is deep sleep, then comes the REM period, then another period of deep.  During the REM period there is some fairly regular Delta spikes while other brainwave frequencies dip.  I have not seen this before.  I do vaguely remember dreaming, something about "discovering cosmic rays in my brainwaves".  Funny-odd that I would dream about my brainwaves when in fact my brainwaves are doing something odd.  The spikes are not related to movement or waking.  I had an IR cam on me and I stepped through the frames.  There was a few movements during the time, but not at all at the times of the spikes or even having any regularity associated with them.  I probably had some arousal during the time, else I would probably not remember the "cosmic rays" thing.

The other thing that was odd last night is that I slept only 4 hours and awoke fairly refreshed and could sleep no longer.  I did have a "power nap" during the day before and I did not take any sleep aids before going to bed.  There's an interesting decrease in the depth and duration of deep sleep that goes on during my sleep cycles that I notice and when the deep cycles diminish to near nothing, I notice I awaken.  More on that in another post.

Saturday, January 28, 2012

An Unusual Night

Last night is noteworthy because it was unusual.  Below you see an annotated chart showing the ResMed data (top chart), Pulse-Ox and Zeo brain waves (middle chart) and at the very bottom, the Zeo 5 minute sleep stages from the Zeo web site.  The "night" was unusual because I had some sort of metabolical "issue" at the beginning, then fell asleep for a while without my ResMed nor pulse-oximeter on, then woke up and put them on and went back to sleep.

The numbers with circles are some interesting points:

 (Click for a bigger image)

1. Before all this I think I had a "hypoglycemic" (diabetic type) episode.  I'm not diabetic, but I felt very strange, broke out in a sweat, felt "minty sweaty" all over my body and very light headed, almost passing out (buzzzz).  It was like I had food poisoning and was going to "pay the price".  I also felt hypotensive so I checked my blood pressure but it was normal.  I became very thirsty and craved sugar.  I drank a large glass of water and a bunch of Oreos and started feeling better.  Strange.

2. After all those Oreo cookies, I felt sleepy and laid down.  I fell asleep for about 3 hours without my xPAP.  I think I was probably snoring pretty good.  Oops. Not proper therapy.

3. I woke up at 12:30 AM, did this-n-that for about 45 minutes, then put on the pulse-oximeter and went to sleep again with the ResMed.

4. About 2 hours into that sleep, I can see in my data I had a cluster of apneas and some distress (breathing with some "excitement").  During this time I de-sated to 86% due to not only long duration apneas, but many in succession.

5. I notice in my Zeo brain wave data that the deeper sleep "fish eyes" that form in my brain waves are more pronounced during my untreated "nap" than during my "sleep".  I think it was because I had gotten that deeper rest first, then later I didn't need it so much.  Just a theory, because every night I see those deep sleep "fish eyes" progressively get smaller during the night, so this fits here as well.

6.  You can see from the brainwaves that I was getting sleepy, that on-set was coming even though I was still awake.  The waves were converging.

Just an odd night and it is interesting to me to see what was going on.

Friday, January 27, 2012

Now have Zeo, CMS and ResMed Data Together

OK, we finally have a successful mechanism to import, store, extract and synchronize Zeo brainwaves and sleep stage classifications (gathered real-time), CMS50E heart rate and spO2 (gathered post-sleep) and now data from the ResMed S9 AutosSet (post-sleep also).  The CMS50E data we, in theory, could capture in real-time as well, but we will leave it a post-sleep import for now.  If we need to do something with it in real-time we'll do it.

Here's an example chart of such synchronized data:


So, in our database we have:

CMS50E:
spO2, Pulse

Zeo (real time)
Delta, Theta, Alpha, Beta 1, Beta 2, Beta 3, Gamma, Sleep Stage,

ResMed:
Mask Pres, Therapy Pres, Exp Press, Leak, RR, Vt, MV, Snore Index, FFL Index, Flow_HD, Mask Pres_HD

Next, I'll come up with a way to summarize various measures from these time series on a nightly basis, as I think I want to analyze and optimize on a nightly basis... what happened the day(s) before, what happened during the night and how will I feel the next day.

As a part of this, I will also create my own "Sleep Stage" metrics, probably not following the medical standards, but something more meaningful.  Sleep is not "binary mutually exclusive states" (Wake, Light, Deep, REM) but as can be seen in the brainwaves, a continuous shifting between various forms of sleep.

Monday, January 23, 2012

Caught a CMS 50E / spO2 Revew Problem

In downloading the data from the CMS 50E pulse-oximeter, which was in record mode overnight, into the spO2 Review software we found a problem...  The spO2 Review software provided by Contec writes *.SPOR files to disk that we import into our software.  When we went to import the SPOR file this AM into our software and queried the data in our software there was none for last night... what?  Our software said the there wasn't any and the last available date for data was tomorrow.  Eh?  So we threw our software into debug mode and watched it read the SPOR file... The data in the SPOR file was reported as starting tonight, not last night.  There must be a bug in either the CMS50E itself or in the spO2 Review software.  We've worked around it now.  Other persons that may be writing a data interface to these files probably should be aware if they don't already know.  It's not a problem in the spO2 Review software because they don't seem to report the date when viewing the pulse and oximetry.

And yes, the CMS 50E / spO2 Review software has a bit of a Y2K issue which we work around also... The year in the file is 2 digits, such as 12 for 2012. Not really a bother, but we have accommodated for that as well because Microsoft .NET does not like two digit years when parsing dates.

Saturday, January 21, 2012

Current Status

Presently we are working on getting the ResMed data into our data analysis tools.  After that is successfully complete, then a software mechanism for entering and tracking various factors at various parts of the day and night that are suspected to influence sleep quality and "how do I feel".  After that, some experiments, which will be very interesting.

The identification of the various "controllable factors" and metrics on quality and "feel" is an ongoing identification process and probably will be for quite a while. There's at least 20 factors (so far, there are more I know) that are in my control that may have an effect and a dozen metrics that can be created that test and measure my performance during various parts of the day.  More on this later.  A lot more.  Stay tuned...

Major Shifts

I've been on Auto Positive Airway Pressure (APAP) therapy since November 14th, 2011.  In the beginning I resigned myself to sleep on my back because I had a full face mask.  I gave it a go for a few weeks.  Results: Better than my sleep study, but generally not real good. I had an AHI averaging about 5 and a one-day peak at 12 and I started getting a lot of "Central Apneas". Now, real Centrals are a problem, because your brain is not telling your lungs to move, and um, ah, that's kind of important.  But in my case I think they were false centrals, more of an artifact of struggling and the ResMed S9 Autoset may score things in its own way.  I called the Dr. anyway and they wanted to increase my pressure to resolve the high AHI score.  I did, for about 45 minutes.  I was over blown and could not tolerate it.  What to do?  My sleep study said I did better on my stomach, I've always been a tummy sleeper (now I know why) and so I found a way to sleep with a full face mask and switched to my tummy.  Wa-La! You can see the big step down in "AHI" in the middle of the chart.


Next, I'm a rather odd duck, I live in multiple places. In the latter part of the above chart, I switched from a home with humidity control and a big bed, to an apartment w/o humidity control and sleep on a smaller bed.  Hummm... you can see the difference by eye.  What factors are at play here, I'm not sure; humidity, bed comfort, apartment living with a bit more distractions, changes in diet, experimenting with the effects of alcohol, or what?

Just a curiosity is all, and a clue to ponder.

I'm A Data Detective

I'm a data detective.  In most of my professional work customers pay me very well (gobs) to come into a situation about which I'm generally and often utterly unfamiliar.  Whether that is about making toilet paper better or estimating production of an oil and gas platform in the North Sea, or the future relative value of thousands of financial securities or the diagnosis of cardiac problems, the list is endless over 20 years. Each situation is quite different and sleep apnea is too, but there is some commonality in the approach.  So, what is my process?  Well, the first thing is to do some thinking...

  1. What are you after?  What are your goals?  Can you measure it numerically?  No?  Find a way. There may be many of them.  Rank them by importance.  Go after the important one first.
  2. What factors, in general terms, are likely to influence your goals?  Which ones are "controllable"?  That is, which factors can you change, which ones can you not?  If you have no controllable factors, you are in a bit of trouble, as you are operating just at the whim of your environment.  That would not be good.
  3. What data do you have about those factors?  Where is it?  Can we get it?
  4. Look at the data, visually by eye, in relation to your goals and each other and how they appear to interact and how "noisy" the data is, how does it move in relation to your goals and each other?  This is more art that I'm trying to make "science" (automated).
  5. Do some preliminary data modeling (that's mathematical) using our software to try to estimate the quantified goals.  Our software is extremely good at sniffing out relations between things even in very noisy data.  Look at which and how the driving factors influence the goals (sensitivity analysis and 3D response curves and surfaces).  Hopefully some of your controllable factors have a significant influence on the results you want, else you are "driving a car with a loose steering wheel".  You make changes but little or nothing changes much.  In that case, again, you are operating somewhat at the whim of your environment.
  6. Of those factors that are in your control and the preliminary modeling indicate has some influence on your goals, do what is considered a "designed experiment", that is, change those factors as much as possible, up and down, keeping within reasonable limits.  This data is golden, as it will give you a clearer picture just how much you can control your goals.  If you jig-jag them around a lot and not much happens... oopsie. Loose steering wheel again.
  7. Remodel the data using the newly generated data. Estimate the current or future values of the goals' values using the models.  Do these estimates usefully approximate the values of the goals?  "Usefully" is important.  You may not be real accurate, but if the result is useful, has value, to the final user, that is goodness.  You might put these models on-line, if data is in real-time and estimate things and maybe alert you to problems.  Or it might be possible before sleeping, given what you have done during the day, to inform you what your sleep quality might be.  Are these estimates useful?  Do they seem to be right?
  8. Lastly, optimize.  Using the models, manipulate (synthetically... the data) the controllable factors to seek the set of values that maximize your good goals and minimize the bad ones.  This is a complex multiple variable optimization of multiple objectives, perhaps within constraints.  Try what it tells you to do.
This process is general, it is adapted to the situation, but it is about what I do to help people and companies (and in this case myself) achieve higher performance. It is somewhat in order of progression, but jumping around is most often done.  For example, if you think you have factors that influence your goals, but later find out you were wrong, you go back and look around.  Or maybe you stated your goals not quite right, that you learned something that changed your mind how you view your goals and quantify them.

We'll see how it goes.

Friday, January 20, 2012

Caveat Emptor

Caveat Emptor (ya, that means this is a disclaimer)

Nothing you read here is medical advice of any sort.  It is, at best, presented here for your amusement and interesting reading only.  Anything you "learn" here, or take away, if used in any way is at YOUR OWN RISK.  If I say something is true, it may not.  If I say something is false, it may be true.  Anything and everything must be verified by you before you use it in any way.

I am barely responsible for myself, and certainly not for you or your treatment.

Oh, and I do go back and edit posts.  Just because I post something here does not mean I won't go back and fix something if I find it wrong, or I need to add some information.  Therefore, if you see something questionable, let me know and I'll edit it and if I feel it is appropriate, I'll mark it as an edit.  This isn't a scientific journal and has no audit trail, nor do I intend it to be one.

Thanks.

Software List

I use a variety of software:
  • SleepyHead. I use this to view my ResMed S9 Autoset APAP machine's data. It's very good, made by a sleep apnea afflicted person, it's free and he's open to donations.
    .
  • spO2 Review.  This comes with the CMS 50E pulse oximeter and I use it to import data from the device and dump it to disk, to be imported by...
    .
  • Our Analytical Software... very powerful analytical "Artificial Intelligence" technology, including a server and suite of desktop tools, of my company's making.  The server gathers, maintains, cleans, filters, converts and processes data, implements "tasks" (technical processing), helps determine cause and effect, time relations in the data, mathematically models data, tells you key drivers of what you are predicting / estimating, makes those predictions and estimates of what is, or will be happening and also performs abnormal condition monitoring and optimization (hopefully of my treatment and my sleep quality or how I feel and perform).  I works well with both historical and real-time streaming data.  In using it for this purpose, we can make our software better as well.  Later, if I find useful things perhaps we will build a product that can do these things for others.
    .
  • Microsoft PowerPoint.  I copy and paste and align charts in Powerpoint for the time being.  As soon as we can put ResMed data into our analytical software, this will no longer be needed.

None of these software packages are "medical devices" and are considered experimental in nature.  Other small utility programs are used also, such as for taking images of charts.

Equipment

I have a variety of equipment that I am using and I might get more, we'll see.  Here's my list:
  • ResMed S9 AutoSet. This is a medical device that is a fully data capable auto positive airway pressure (APAP) sleep apnea treatment system.  It applies a varying air pressure to my face using a sealed mask, which forces my airway open if it needs to as I sleep.  This device gives me information such as:
    * Event Flags: What kind of breathing event I have, when it occurred and for how long
    * Air Flow Rate as I breath in and out
    * Mask Pressure which varies as the machine tries to eliminate events
    * Tidal Volume which is the amount of air I'm breathing in and out
    * Minute Ventilation, similar to Tidal Volume, but the amount per minute.
    * AHI, an index that reports the events/hour.
    * Leak rate (how much the mask is leaking)
    * Snore Index (how much I'm snoring)
    * Respiration Rate (breaths / minute)

    Data from the ResMed S9 AutoSet is from an SD card, which you pop out of the ResMed S9 AutoSet and put into a card reader in your PC.  Presently, until I can get this data into our software, I use SleepyHead to view trend charts with it.

    Note: I highlight the word AutoSet because so there is no confusion with other ResMed "Auto" machines that are not necessarily data capable.
    .

  • CMS 50 E Pulse Oximeter.  This is a that device clips on my finger and as I sleep it records my heart rate and blood oxygen levels (spO2).  It is not a medical device, and is therefore not very accurate, but good enough to know what is going on.  The pulse rate is reasonably accurate.  The spO2 is within 2% when above a 70% spO2 reading.

    Data from the CMS 50 is available through a provided USB/Serial cable and the data can stream from the device in real-time, or the device can store it for up to 24 hours each session and then it can be transferred to your PC using the provided USB/Serial cable.  It comes with two software applications; real-time and session review (SpO2 Review).  I use the latter to fetch sessions off of the device and the SpO2 Review application dumps the data to disk, which then I import into our software.

    Available from Amazon (?) or the PulseOxStore.
    Software and the device driver, if you need them, may be found here at the PulseOxStore.
    .

  • Zeo Bedside Sleep Management System. (psst... you can get it cheaper on Amazon).  A rather cool non-medical device that has a headband that you wear and it measures electrical activity through the skin on your forehead.  This activity is in part facial movements but principally your brain's frontal lobe electrical activity.  The Zeo Bedside gathers this data in a fancy alarm-clock and generates various information about your sleep, most notably crude, but generally correct, estimates of what your sleep stages (Wake, REM, Light and Deep) were during the night every 5 minutes. It is computing this every 30 seconds based on frequencies calculated every second, based on a brain electrical activity measured 128 times per second.

    Data from the Zeo is available either through

    * An SD card, on which there is a night's sleep session, which then can be transferred to your PC, uploaded to their web site and used in a user friendly sleep coaching system with lots of interesting charts, statistics and such.  You can also download data, summarized by night, to your PC again in a CSV file, one column of which has 30 second sleep stage estimates.

    * A serial port in real time.  The Zeo does not come with a USB/Serial cable however, you must make one. :(  I did and I'll tell you how.  And when you do make one, there is an application called ZeoScope that enables you to see your brainwave and the amplitude (I think) of Alpha, Beta (1, 2, 3), Delta, Gamma, Theta frequencies the impedance of the band on your skin and also the sleep stages the Zeo is estimating.

    Presently, I use both the SD card / web site to get Sleep Stage charts and a serial cable to collect the real-time stream into our software.

  •  X16-1C Accelerometer by Gulf Coast Data Concepts.  Tells me the orientation of my body and head while I sleep, such as on my belly, head to left or right, or on my back, head left or right.  This device confirmed without a doubt my positional sleep apnea.

    This device is not only an accelerometer, but a USB thumb drive that contains the data it creates in text CSV file format.  Spiffy !  Easy.

Who Am I?

Well, I'm not going to tell you exactly who I am but I'll tell you a bit about me. 

  • I have sleep apnea which damn near killed me, or so my sleep doctor/neurologist and I surmise
  • I am somewhat sleep impaired and maybe slightly cognitively impaired from this condition. Bear with me, I'm doing this in part to get better. I'm groggy a lot these days. I may have more than just sleep apnea or maybe I've had some brain damage from it.  It is frustrating for me, one who used to think so clearly and quickly.
  • I run a data analysis software and services company with small, medium and big name customers all over the world.  I have an impressive arsenal of tools, technologies and experience at my fingertips.
  • I used to work at a Fortune 50 manufacturing company, from the factory floor to management up to the point I had access to the executive dining room and corporate jets. I quit that career to start my software and services company.
  • I'm a professional data sleuth, hired by companies to figure out what causes problem (and successes!).  As an example, DuPont hired me to figure out why they could not make nylon.  They invented the stuff!  I analyzed their data, used some engineering sense and told them why.
  • I am a Chemical Engineer, so I have an "engineering brain"
  • I'm in my 50's and male.
  • I am a software guy, not hardware.  Give me a soldering gun and I'll burn myself.  Give me some data and I'll do miracles.
  • I don't know a lot about sleep, sleep apnea, brain waves, power spectra, signal processing, but I'm learning what I need to learn
  • I've been from Malaysia to Moscow, the later courtesy of a minister of finance, who took me to the Bolshoi for opera and gave me a personal tour of the Kremlin, have used oxygen masks on a plane plummeting from the sky, had my hotel catch fire once, emergency landed in a DC-10 in an Inuit Eskimo village, enjoyed our 20th wedding anniversary in the jungles of Borneo chest deep in bat guano (see Mulu Resort), detained as a currency smuggler at an airport once, but got off by bribing the Russian with cognac and chocolates. Those are a few of my stories... I have many more.
PS: I am new to this, so forgive me if I make mistakes as I learn...

The Purpose of this Blog


The purpose of this blog is varied... First and foremost, a patient should be intimately involved in their care.  No one has higher stakes. Second, you are your best, and sometimes only, advocate. Taking a proactive approach to your own care is important in getting the best results.  Your doctor is a key aspect of that and should be consulted before taking any significant action, but they also have their limitations.  They often see you briefly, see you in a snapshot in time, but with the tools and technology available today you can gain a perspective of your condition(s) over time, in varying situations.  You can be more informed and can achieve a better treatment.

  • Important
    I want to understand sleep apnea
    so I can get the best treatment to avoid the fatal consequences (see My Story).  That's a great motivator!  This medical condition may have given me brain damage, I sense a loss in terms of doing complex work, and I'm doing my best to get back to my full potential.
    .
  • Interesting
    When Sleep Apnea revealed itself, I said, "Oh boy, you picked on the WRONG guy!"
    ... I'm a 20 year professional expert in analytics. Yes,
    I'm a data analysis geek extraordinaire of sorts and I have great tools available to me to analyze a myriad of data about the condition.  In addition to great tools, I have various equipment that gives me lots of interesting data about how I sleep:

    => a data capable APAP machine (ResMed S9 Autoset) that can tell me about breathing events (apneas of various sorts),

    => a reasonably affordable CMS50E pulse-oximeter that I can use to see my heart rate and oxygen saturation during the night and also

    => a Zeo Bedside unit.

    All of these I will be spending a lot of time talking about here.
    .
  • I want to better understand sleep so I can improve my rest, performance and well being.
    .
  • Oh, and Kind of Important
    I may have a mild form of narcolepsy and I'm trying to figure out if I actually have it or not before having a study to determine it via my doctor.
This blog chronicles my adventures...


My Story with Sleep Apnea

Hi, I'm Max Darkside (not my real name, but we'll go with it). I was recently diagnosed with moderate to severe sleep apnea. Here's my story. The "Clues" are symptoms of this disorder.

I have a history of snoring (CLUE #1) and my wife told me I stopped breathing at night (CLUE #2). Over the last few years, I was getting groggier and groggier during the day (CLUE #3) to the point my work was suffering. The groggier I got, the more I smoked and drank coffee to make up for it. I have high blood pressure (CLUE #4) that just appeared one day some years ago after getting sick from stupidly drinking milk in India (another story). Then, in 2011 the arrhythmias started (CLUE #5)... heart flutters, now and then, at times. Then, on August 1st, while I was walking in a parking lot my heart started pounding and fluttering, then it stopped. Not only the fluttering stopped, but my heart. My chest started feeling like it was filling like an inflating balloon. Euphoria came over me that got stronger and stronger until I was embraced in the warm love of God Himself. The world was turning white and I fell to my hands and knees clutching my chest in complete euphoria (OMG IT WAS WONDERFUL !) and as I died, starting to roll over and succumb to the warm, embracing euphoria, I decided to fight it with all my will. I HAVE A WIFE, KIDS, and I WAS CERTAINLY NOT GOING TO DIE ALONE IN A PARKING LOT !! I fought hard to get back to my feet, I staggered... stumbled up onto my feet and the euphoria faded and my chest felt like it deflated and I felt NORMAL ! Like nothing had happened.


I went to the doctor and he called me a "flat liner", someone who had died and came back. I said I wanted a sleep study and he ordered it. They found I had moderate to severe sleep apnea and the sleep doctor / neurologist called my euphoric event a "Significant Arrhythmic Event", AKA Ventricular Fibrillation with a 99+% probability of dying when unaided.

Between the time I was diagnosed and when I got my Auto Positive Airway Pressure (APAP) machine I was yet untreated and going downhill fast. You see, sleep apnea strangles you in your sleep, a little at a time, night after night, starving your brain of oxygen. Have it severe enough, for long enough and it will do brain damage. Well, quickly I could not function at work and I was getting groggier during the day and the arrhythmias worsened. It got to the point that I was in a store with my wife and son and I wandered over one aisle and had a cognitive failure... I did not know where I was or how to get back to my wife and son. That, for me, was very scary. The next week it happened again, when I came out of a grocery store I saw a parking lot... I didn't know what a parking lot was nor did I know why it was there.  I stopped and stared. It took a few moments to realize that this is where the car is and I needed to go to the car, wherever that was.

The doctors tell me treatment for sleep apnea will help reduce the chance of another "Significant Arrhythmic Event" that might kill me next time. I hope they are right. I'm not sure though, I'm having the arrhythmias again.

On Nov. 14, 2011 I got my ResMed S9 Autoset and got therapy...

I am better at work, but I sense that I've lost some cognitive abilities. I am much better, tho still groggy each day.