Friday, April 27, 2012

Progress

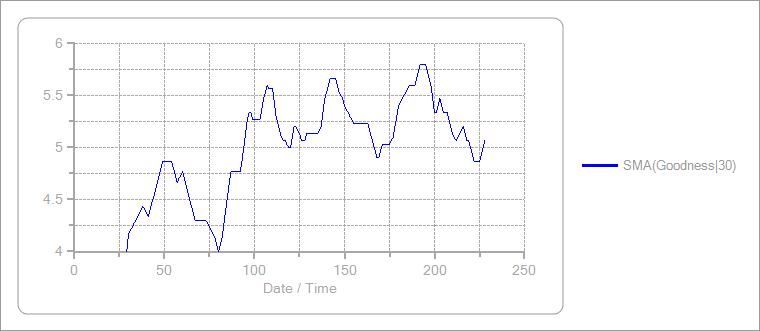
Time for a progress update on my personal performance.  Below you will see 3 trends, my Zeo sleep score, my "Whack a Mole" and my "Goodness", each smoothed with a moving average, since February 20th, 2012.  So, I've been collecting this data for about 67 days.


The Zeo Sleep Score above comes from the Zeo Bedside unit where it scores my sleep by length, quantities of REM and Deep and deducts points for number of times I wake and duration awake.  My Zeo Sleep Score has been trending upward.  Good.

The "Whack-a-Mole" is a measure of my response time by measuring the average time it takes for me to click on a little picture that jumps around a window.  I take this "test" most every morning and sometimes during the day as well.  Lower is better.  My response time is becoming faster, but I sense it is leveling off.

Above is my personal subjective feeling of "Goodness".  How good I feel which I record using a slider, higher is better.  It has also been rising but I see it leveling off.  That may be because I am in fact reaching a plateau or there's a psychological aspect to adapting to "better" and not wanting to slide the bar higher.  These kinds of things is why I collect a variety of performance metrics, and these 3 are not the only ones, there are 8 of them I collect (?!).

OK, so, I've been getting better and that is good news.  I might be reaching a plateau and that is something to ponder ... how to take the next step up.

Tuesday, April 24, 2012

Comparison: "Sleep like Android" vs. Zeo

Someone mentioned accelerometer based sleep monitors and there so happens to be a popular one for my Android (Motorola Android Razr Maxx) called "Sleep like Android" so I downloaded, installed, read through the instructions.  You plug your phone into the power (so it does not fully discharge) and put your phone on the mattress and "Sleep like Android" uses the phone's accelerometer to detect movement to try to classify your sleep in simplistic terms, on a continuum from Deep to Light.  The idea is if you are moving, you are awake or in light sleep, or maybe REM, or something.  Below is an image that compares my ResMed S9 AutoSet respiration (low and stead during Deep, volatile during REM) and my Zeo (big 'eyes' during Deep, volatile during REM) with the Zeo classifications from their website at the bottom.  The black chart is the "Sleep like Android" output.

You can see the "Sleep like Android" output does NOT match with anything from the medical device (ResMed) nor the Zeo brain wave monitor.  It shows "light" during Deep, shows "deep" during REM, the Zeo shows some "Wakes" but nary a blip on the "Sleep like Android"

I may try some additional nights to double check, but in my initial view... "Sleep like Android" does not work and is not useful, at least for me.  This does not suggest other accelerometer based sleep monitors do not work, just that the "phone on a mattress" look to be a weak solution.

Major advantage: My phone was fully charged in the morning, ready for a busy day. :)

Monday, March 19, 2012

Making a Zeo Cable

The Zeo Bedside unit has a serial port which emits the raw signal it picks up from your forehead, the brainwaves; Delta, Theta, Alpha, Beta 1, Beta 2, Beta 3 and Gamma, the sensor impedance and also the 30 second sleep stages.  How do you get this data?

1) Make a cable
2) Get and install a "Real time" firmware upgrade into the Zeo Bedside unit.
3) Get ZeoScope (free)

--------------------

The Cable
The Zeo Bedside's serial port can be connected to your PC using a Serial -to- USB cable, but Zeo does not sell one and if you want the data, you must make it. The cable itself is a RS-232 Serial to USB, so there's a chip in the USB connector thus one cannot use a standard USB cable and "hack it up". To make mine I followed the directions here:
http://www.sleepstreamonline.com/rdl/starting.html

To make it, I got these parts:

http://www.mouser.com/Search/ProductDet ... 16-02-1114
(5 each, to have a couple spares, they are cheap... wire termination connector clip thingys)

http://www.mouser.com/Search/ProductDet ... 50-57-9405
(1 each the plastic 5 pin connector)

http://www.mouser.com/Search/ProductDet ... 32R-3V3-WE
(1 each, $20... the cable itself)

--------------------

The Firmware Upgrade
It's explained step by step at the same web page on how to make the cable:
http://www.sleepstreamonline.com/rdl/starting.html

--------------------

ZeoScope
ZeoScope is PC software available for free here:
http://www.github.com/dancodru/ZeoScope

Have fun watching your brainwaves streaming by... Look left, look right, watch the wave patterns.  Take off the Zeo headband and press it against your chest... WOO... One of the weirdest EKG's you've ever seen. :)

Saturday, February 25, 2012

Zeo Sleep Score: Mean Anything?

The Zeo puts out a sleep score based on hours slept, the amount of time in REM and Deep sleep and the number and duration of waking during the night.  Does this have any bearing on how you feel or perform, really?  In some initial data collection, the answer is YES. 

From time to time I do a home-made "Whack-A-Mole" type of measurement of response time.  In this little performance game an image appears in random locations 10 times in a window and I must mouse to the image and click on it.  The average time it takes between clicks is logged each time I play the game.

If I do a chart of my Zeo Sleep Score vs. my response time it looks like this:


You can see when my Zeo Sleep Score is low, my response time is high (I'm slower to respond) and the reverse is true.  Mathematically the correlation is low, but to our eyes we can see there is a relationship between these two independently arrived at metrics.

Wednesday, February 22, 2012

Clustering Zeo Brainwaves

One reason "sleep stages" exist is so one can quantify how much time was spent in what kind of sleep. It is a multiple level discrete classification of what in reality is a continuous process, but none the less the concept of "sleep stages" is useful.  I would like to identify the nature of my sleep and associate how I feel the next day based on how much of what kind of sleep I had.  If I can identify and count the duration of different kinds of sleep I might be able to correlate that with how I feel, hence I could then get a handle on sleep quality.  People say the more "Deep" and "REM" you get the better, but I'm guessing there's more to that story.

The challenge I have is that I only have a Zeo, which is a 3 lead frontal lobe EEG non-medical device and I get a bit confused on how sleep is categorized based on the dominance of this wave or that.  This is compounded by each person being different and I read today that Obstructive Sleep Apnea (OSA) persons have somewhat abnormal sleep as well.  I could use Zeo's classification of sleep stages (I might, I have them in real-time) or I could come up with my own scheme.  In this adventure, I going to make my own.

I have Zeo brainwaves (Delta, Alpha, Betas, Theta, Gamma) and sleep stages (Wake, REM, Light, Deep) gathered via a serial port from the Zeo Bedside unit archived in real-time to a historian.  I can extract the data between one date/time and another such as a night's sleep.  Last night's data looks like this:


Now, I'm no expert in sleep stages, but I am one in data analysis and I see a few different forms of sleep.  For this adventure I'm not going to try to identify the sleep stages using the established medical definitions (if it is even possible with the Zeo), but I'm going to let the data itself decide what it sees.  How am I going to do this?

Clustering
Clustering is a data method that separates data into "piles" (clusters) based on their similarities and differences.  In this case the software looks at each moment in time and decides if the Delta, Alpha, Betas, Theta, Gamma wave values (amplitudes) are similar to all the other cases.  In this exercise I took noise out of the data by taking 30-45 second averages of the data (just a double-click in our software).  Then using a "Self Organizing Map" (SOM), I group the data based on its similarity.  SOM's use a process that moves similar data towards each other, and dissimilar data away from each other, on a two dimensional map.  That way I can take the 7 wave forms (7 dimensional data) and project it on a 2D surface, like moving chips around on a table, putting similar ones together automatically.  We humans can think in 2D and 3D pretty good.  7D is very difficult for us mere mortals. What you get after the SOM groups the data is something that looks like this:


Very pretty.  Rather impressive.  Good to have on your desktop when the boss walks by if you are a data analysis person (wink).  Each square has very similar data within it and neighboring squares also have data with similar characteristics.  The closer the squares, the closer the values.  Adjacent red regions contain very similar values.  The green, yellow and blue indicate larger differences, like mountains or valleys between the red regions.  I can group these squares (and the data within them) into clusters of similar data by setting a "data distance" (dissimilarity) criteria.  Below you can see 5 different gray regions (clusters) each of which contain similar data.


OK, so what, you ask?  Well, I can then export out the members (rows of data) of those clusters and their cluster number.  That cluster number is very similar in concept as a sleep stage and look at what it shows us...


At the very bottom you can see the blue line that is our "home-made" Sleep Stages but in a different numbering scheme, independent of any medical professional, based on my personal data.  In comparing the cluster number to the Zeo's sleep stages I can see it is somewhat similar to what the Zeo indicates, but I also see that my scheme identifies the character of the data better, because the Zeo is trying to conform to medical definitions where mine conforms reality.

The blue line is actually smoothed with a simple algorithm that says if the current row of data is uncategorized (not in a cluster) then presume it to be in the just-prior cluster.  That's not perfect, but a pretty good assumption on a real-time continuous process like the brain.  Doing this type of post-processing helps reduce the noise in our new "Sleep Stage".

Next Steps
I can run this clustering "model" in real time with the wave data coming in and auto-assigned to my custom sleep stages and either in real time or after I wake up I can count how much time I slept in what type of sleep.  I can use this, or the Zeo's sleep stages, or both to hopefully correlate that with how I feel the next day, and also correlate it with what I did before to get such sleep.  We'll see about that in future posts.

The Button Box

I've begun the collection of a variety of factors that chronicle my response time, how I feel, nutritional factors, exercise, stress at home and work, medications I take, APAP settings, sleep environment, blood pressure, Zeo sleep scores, etc.  To do this, I have created a "button box" that I can click an appropriate button and record these things.  It's not a real flexible application suitable for others, but it does the job OK for me.  I think I have most of the factors I would like to capture and I may add more as I go forward.  The most important is how I feel and so I have buttons for overall goodness (1-10), groggy, achy, headache, puffiness, arrhythmias.


When I click a button, depending on the nature of what I'm recording, different things happen.  For response time, I am asked when I woke up and how long it takes to set a time control is logged.  Then a "whack-a-mole" type of little game appears where I have to click on a image which then randomly moves to another position on the screen.  It moves 10 times.  The average time between the image appearing and when it gets clicked is recorded.  This actually seems to capture my hand-eye coordination skills fairly well. For exercise, it asks for the start time, duration and the average heart rate (a proxy for exertion).  For single dose things, like taking an Excedrin (aspirin / acetaminophen), it just records a "1" in the Excedrin variable.  Some factors ask for a judgment on a scale of 1-10.  All entries are time stamped so I can later compute their timing, inter-relationships through time, etc. If I look at them as being before a sleep they potentially could then be a causal factor, or perhaps look at them as coming after sleep, making them a potential a consequence of good or poor sleep.

What am I going to do with this data?  A lot!  That will be the fuel for a lot of future topics.

Greatest challenge: The discipline to use it.  When I do something, I need to click

Wednesday, February 15, 2012

Attaching the CMS50E PulseOx for Overnight

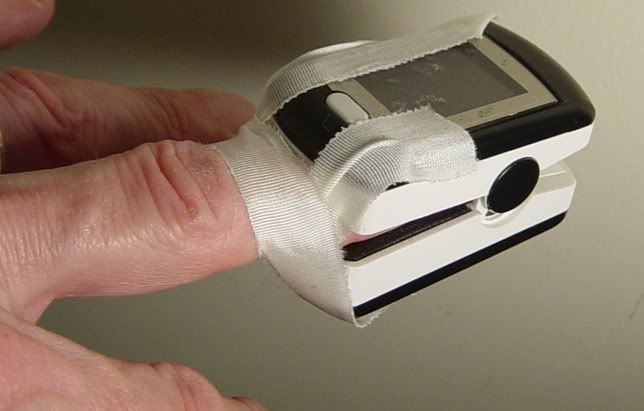
I use the Contec CMS50E pulse oximeter and put it into record mode and sleep with it on my finger.  OK, so how do I not have it fall off at night?  I tape it on...

I tear two 0.25" wide strips of medical tape about 4" long. I put on the CMS50E then drape the center of the tape over my finger and attach the tape ends on the underside of the pulse ox, then repeat such that the 2nd piece of tape comes up from under wrapping my finger and the ends are on the top of the pulse ox (or vise-versa, as shown). I can use the tape tension to control how tight the pulse ox is clamping on my finger. The two pieces of tape last a couple weeks before needing to tear off a couple more strips. I have great control over tension of the clamping-on of the device, from crushing to flippy-floppy and everywhere between. Try it. It won't come off.