Wednesday, February 22, 2012

Clustering Zeo Brainwaves

One reason "sleep stages" exist is so one can quantify how much time was spent in what kind of sleep. It is a multiple level discrete classification of what in reality is a continuous process, but none the less the concept of "sleep stages" is useful.  I would like to identify the nature of my sleep and associate how I feel the next day based on how much of what kind of sleep I had.  If I can identify and count the duration of different kinds of sleep I might be able to correlate that with how I feel, hence I could then get a handle on sleep quality.  People say the more "Deep" and "REM" you get the better, but I'm guessing there's more to that story.

The challenge I have is that I only have a Zeo, which is a 3 lead frontal lobe EEG non-medical device and I get a bit confused on how sleep is categorized based on the dominance of this wave or that.  This is compounded by each person being different and I read today that Obstructive Sleep Apnea (OSA) persons have somewhat abnormal sleep as well.  I could use Zeo's classification of sleep stages (I might, I have them in real-time) or I could come up with my own scheme.  In this adventure, I going to make my own.

I have Zeo brainwaves (Delta, Alpha, Betas, Theta, Gamma) and sleep stages (Wake, REM, Light, Deep) gathered via a serial port from the Zeo Bedside unit archived in real-time to a historian.  I can extract the data between one date/time and another such as a night's sleep.  Last night's data looks like this:


Now, I'm no expert in sleep stages, but I am one in data analysis and I see a few different forms of sleep.  For this adventure I'm not going to try to identify the sleep stages using the established medical definitions (if it is even possible with the Zeo), but I'm going to let the data itself decide what it sees.  How am I going to do this?

Clustering
Clustering is a data method that separates data into "piles" (clusters) based on their similarities and differences.  In this case the software looks at each moment in time and decides if the Delta, Alpha, Betas, Theta, Gamma wave values (amplitudes) are similar to all the other cases.  In this exercise I took noise out of the data by taking 30-45 second averages of the data (just a double-click in our software).  Then using a "Self Organizing Map" (SOM), I group the data based on its similarity.  SOM's use a process that moves similar data towards each other, and dissimilar data away from each other, on a two dimensional map.  That way I can take the 7 wave forms (7 dimensional data) and project it on a 2D surface, like moving chips around on a table, putting similar ones together automatically.  We humans can think in 2D and 3D pretty good.  7D is very difficult for us mere mortals. What you get after the SOM groups the data is something that looks like this:


Very pretty.  Rather impressive.  Good to have on your desktop when the boss walks by if you are a data analysis person (wink).  Each square has very similar data within it and neighboring squares also have data with similar characteristics.  The closer the squares, the closer the values.  Adjacent red regions contain very similar values.  The green, yellow and blue indicate larger differences, like mountains or valleys between the red regions.  I can group these squares (and the data within them) into clusters of similar data by setting a "data distance" (dissimilarity) criteria.  Below you can see 5 different gray regions (clusters) each of which contain similar data.


OK, so what, you ask?  Well, I can then export out the members (rows of data) of those clusters and their cluster number.  That cluster number is very similar in concept as a sleep stage and look at what it shows us...


At the very bottom you can see the blue line that is our "home-made" Sleep Stages but in a different numbering scheme, independent of any medical professional, based on my personal data.  In comparing the cluster number to the Zeo's sleep stages I can see it is somewhat similar to what the Zeo indicates, but I also see that my scheme identifies the character of the data better, because the Zeo is trying to conform to medical definitions where mine conforms reality.

The blue line is actually smoothed with a simple algorithm that says if the current row of data is uncategorized (not in a cluster) then presume it to be in the just-prior cluster.  That's not perfect, but a pretty good assumption on a real-time continuous process like the brain.  Doing this type of post-processing helps reduce the noise in our new "Sleep Stage".

Next Steps
I can run this clustering "model" in real time with the wave data coming in and auto-assigned to my custom sleep stages and either in real time or after I wake up I can count how much time I slept in what type of sleep.  I can use this, or the Zeo's sleep stages, or both to hopefully correlate that with how I feel the next day, and also correlate it with what I did before to get such sleep.  We'll see about that in future posts.

The Button Box

I've begun the collection of a variety of factors that chronicle my response time, how I feel, nutritional factors, exercise, stress at home and work, medications I take, APAP settings, sleep environment, blood pressure, Zeo sleep scores, etc.  To do this, I have created a "button box" that I can click an appropriate button and record these things.  It's not a real flexible application suitable for others, but it does the job OK for me.  I think I have most of the factors I would like to capture and I may add more as I go forward.  The most important is how I feel and so I have buttons for overall goodness (1-10), groggy, achy, headache, puffiness, arrhythmias.


When I click a button, depending on the nature of what I'm recording, different things happen.  For response time, I am asked when I woke up and how long it takes to set a time control is logged.  Then a "whack-a-mole" type of little game appears where I have to click on a image which then randomly moves to another position on the screen.  It moves 10 times.  The average time between the image appearing and when it gets clicked is recorded.  This actually seems to capture my hand-eye coordination skills fairly well. For exercise, it asks for the start time, duration and the average heart rate (a proxy for exertion).  For single dose things, like taking an Excedrin (aspirin / acetaminophen), it just records a "1" in the Excedrin variable.  Some factors ask for a judgment on a scale of 1-10.  All entries are time stamped so I can later compute their timing, inter-relationships through time, etc. If I look at them as being before a sleep they potentially could then be a causal factor, or perhaps look at them as coming after sleep, making them a potential a consequence of good or poor sleep.

What am I going to do with this data?  A lot!  That will be the fuel for a lot of future topics.

Greatest challenge: The discipline to use it.  When I do something, I need to click

Wednesday, February 15, 2012

Attaching the CMS50E PulseOx for Overnight

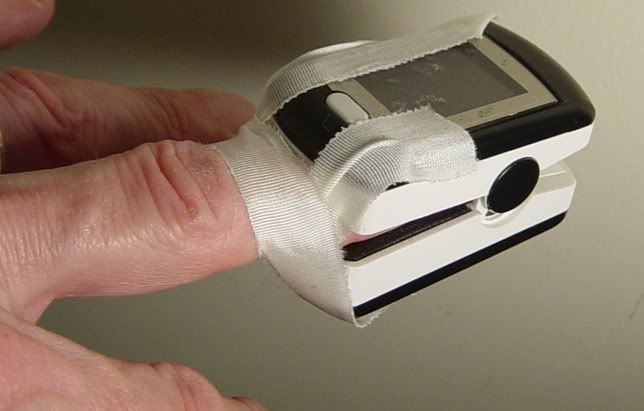
I use the Contec CMS50E pulse oximeter and put it into record mode and sleep with it on my finger.  OK, so how do I not have it fall off at night?  I tape it on...

I tear two 0.25" wide strips of medical tape about 4" long. I put on the CMS50E then drape the center of the tape over my finger and attach the tape ends on the underside of the pulse ox, then repeat such that the 2nd piece of tape comes up from under wrapping my finger and the ends are on the top of the pulse ox (or vise-versa, as shown). I can use the tape tension to control how tight the pulse ox is clamping on my finger. The two pieces of tape last a couple weeks before needing to tear off a couple more strips. I have great control over tension of the clamping-on of the device, from crushing to flippy-floppy and everywhere between. Try it. It won't come off.


Wednesday, February 1, 2012

Still Preparing: Events

I'm still preparing for having all the data I need / want.  I have the Zeo's brainwaves in real-time, Contec CMS 50E post-sleep (which is fine getting it after the fact for now) and the ResMed S9 AutoSet data post-sleep (I don't know how to get it real-time, tho it has a serial port).  So, for the real-time time series I'm in pretty good shape.  However, I need to track various "events".

Events
An event is something that occurs at a time and generally has a start-time, end-time and duration.  Having any two allows you to calculate the third automatically.  So we put an "Event" object into our software and put them to use because I have events from the ResMed S9 AutoSet; hypopneas, obstructive apneas, central apneas and recording start events.  In ResMed terms, the apneas have an end-time and duration because they are determined after the fact, and the recording start event is instantaneous: the start-time only.  These are already gathered and stored in our real-time historian with the ResMed data collection we do.  This is spiffy because our software has multiple tasks, an spO2 and ResMed file watcher watching a directory and when I've gathered the files I just drag and drop them into that folder where they are "sucked up" and the data is put into the real-time database and the original files are automatically archived for back-up purposes.  OK, I'm getting off topic...

I need to add my own events too, such as periods of time I feel groggy, or really good, or something else of merit that should be recorded.

Doses
A close cousin to an event is what I call a "Dose".  This is an event like activity (has a time and maybe a duration) that has a quantity associated with it.  I call it a Dose because it's like taking a medicine.  "I took X mg of Y drug at Z time", or I just drank a full pot of coffee at this time.  Even exercise is like a dose, "I averaged an aerobic heart rate of X from this time to that time".  Having these events, time stamped, with quantities, gives me information about how much, how long before sleep-onset they occurred, or totaled during the day.  This way I can log that I had a pound of steak for dinner, or took two Excedrin at 10 PM or had an hour of "this strenuous" exercise at 2 PM or 1 cup of Tulsi Tea 10 minutes before bed, etc.

Once I have these Events and Doses, and a means to enter them easily, I'll have I think all that I need.

Strange REM

As I continue to prepare for doing some experiments (more on that in the next post) I had some strange brainwaves during my first REM period last night.  Check out the chart below:

(click for a bigger picture)

This is an image of the various frequencies streaming real-time out of the Zeo into our software during the period of interest in my sleep last night. The first section that looks domed, or a "fish eye" as I call it, is deep sleep, then comes the REM period, then another period of deep.  During the REM period there is some fairly regular Delta spikes while other brainwave frequencies dip.  I have not seen this before.  I do vaguely remember dreaming, something about "discovering cosmic rays in my brainwaves".  Funny-odd that I would dream about my brainwaves when in fact my brainwaves are doing something odd.  The spikes are not related to movement or waking.  I had an IR cam on me and I stepped through the frames.  There was a few movements during the time, but not at all at the times of the spikes or even having any regularity associated with them.  I probably had some arousal during the time, else I would probably not remember the "cosmic rays" thing.

The other thing that was odd last night is that I slept only 4 hours and awoke fairly refreshed and could sleep no longer.  I did have a "power nap" during the day before and I did not take any sleep aids before going to bed.  There's an interesting decrease in the depth and duration of deep sleep that goes on during my sleep cycles that I notice and when the deep cycles diminish to near nothing, I notice I awaken.  More on that in another post.

Saturday, January 28, 2012

An Unusual Night

Last night is noteworthy because it was unusual.  Below you see an annotated chart showing the ResMed data (top chart), Pulse-Ox and Zeo brain waves (middle chart) and at the very bottom, the Zeo 5 minute sleep stages from the Zeo web site.  The "night" was unusual because I had some sort of metabolical "issue" at the beginning, then fell asleep for a while without my ResMed nor pulse-oximeter on, then woke up and put them on and went back to sleep.

The numbers with circles are some interesting points:

 (Click for a bigger image)

1. Before all this I think I had a "hypoglycemic" (diabetic type) episode.  I'm not diabetic, but I felt very strange, broke out in a sweat, felt "minty sweaty" all over my body and very light headed, almost passing out (buzzzz).  It was like I had food poisoning and was going to "pay the price".  I also felt hypotensive so I checked my blood pressure but it was normal.  I became very thirsty and craved sugar.  I drank a large glass of water and a bunch of Oreos and started feeling better.  Strange.

2. After all those Oreo cookies, I felt sleepy and laid down.  I fell asleep for about 3 hours without my xPAP.  I think I was probably snoring pretty good.  Oops. Not proper therapy.

3. I woke up at 12:30 AM, did this-n-that for about 45 minutes, then put on the pulse-oximeter and went to sleep again with the ResMed.

4. About 2 hours into that sleep, I can see in my data I had a cluster of apneas and some distress (breathing with some "excitement").  During this time I de-sated to 86% due to not only long duration apneas, but many in succession.

5. I notice in my Zeo brain wave data that the deeper sleep "fish eyes" that form in my brain waves are more pronounced during my untreated "nap" than during my "sleep".  I think it was because I had gotten that deeper rest first, then later I didn't need it so much.  Just a theory, because every night I see those deep sleep "fish eyes" progressively get smaller during the night, so this fits here as well.

6.  You can see from the brainwaves that I was getting sleepy, that on-set was coming even though I was still awake.  The waves were converging.

Just an odd night and it is interesting to me to see what was going on.

Friday, January 27, 2012

Now have Zeo, CMS and ResMed Data Together

OK, we finally have a successful mechanism to import, store, extract and synchronize Zeo brainwaves and sleep stage classifications (gathered real-time), CMS50E heart rate and spO2 (gathered post-sleep) and now data from the ResMed S9 AutosSet (post-sleep also).  The CMS50E data we, in theory, could capture in real-time as well, but we will leave it a post-sleep import for now.  If we need to do something with it in real-time we'll do it.

Here's an example chart of such synchronized data:


So, in our database we have:

CMS50E:
spO2, Pulse

Zeo (real time)
Delta, Theta, Alpha, Beta 1, Beta 2, Beta 3, Gamma, Sleep Stage,

ResMed:
Mask Pres, Therapy Pres, Exp Press, Leak, RR, Vt, MV, Snore Index, FFL Index, Flow_HD, Mask Pres_HD

Next, I'll come up with a way to summarize various measures from these time series on a nightly basis, as I think I want to analyze and optimize on a nightly basis... what happened the day(s) before, what happened during the night and how will I feel the next day.

As a part of this, I will also create my own "Sleep Stage" metrics, probably not following the medical standards, but something more meaningful.  Sleep is not "binary mutually exclusive states" (Wake, Light, Deep, REM) but as can be seen in the brainwaves, a continuous shifting between various forms of sleep.